COVID cases from COVID test results
Each time the COVID positive test cases have been going up again, I’ve heard the same sentence: “they largely understimate the actual number of cases, there is at least 10 times more!”.
So out of fun, I decided to create a small statistical model, to quantify how things evolve under reasonnable assumptions.
Interestingly, under this very simple model, it becomes impossible to say “it’s at least 10 times more” in a general way: the underestimation of cases highly depends on the actual number of positive tests detected!
A realistically naive statistical model for COVID
Let’s try to estimate how many real cases of COVID are being a given number of positive tests at the national level. To be able to perform such evaluation, we first need to defined a model which will encode our assumptions.
We will consider the following random variables:
- C: indicates whether or not a person has COVID
- S: indicates whether or not a person has symptoms related to COVID
- T: indicates whether or not the person got tested
- R: indicates whether or not the person got a positive test result
The causal diagram of our model is as follows:

- The presence of symptoms S depends on whether you have COVID (50% percentage chance to have some if you have COVID C or else 10% due to some other disease)
- Whether you get tested T depends on whether you have symptoms S: 50% of people with symptoms go get a test while the non-symptomatic are 1% percent likely to get a test for administrative reasons
- Getting tested positive R depends on whether you got tested T (you have 0% to be positive if your not tested) and also on whether you have COVID C (with 2% false positive and 5% false negative)
Our goal now will be to use this model to deduce the number of persons who do have COVID (our unknown) from the number of positive tests that are reported.
Bayesian Networks
The causal diagram (1) above actually defines a Bayesian network. It encodes the decomposition of the joint probability of all those random variables:
$p(C,S,T,R) = p(R|T,C) p(T|S) p(S|C) p(C)$
Instead of the normal joint probability decomposition that follows from the chain rule of probabilities:
$p(C,S,T,R) = p(C|S,T,R) p(S|T,R) p(T|R) p(R)$
Thanks to this joint probability decomposition, we will be able to simplify our calculations, as we known that some variables are either indepent or conditionally independent from each other.
In particular, we have:
$p(R) = \sum_T \sum_S \sum_C p(R|T,C) p(T|S) p(S|C) p(C)$
$p(R) = \sum_T \sum_C p(R|T,C) \sum_S p(T|S) p(S|C) p(C)$
(1) Bayesian networks don’t have to be causal, but they are usually better designed as causal because it helps reduce the number of edges they have, hence simplifying the formula for the joint probability.
Working out the numbers
We can easily code a Python program that computes this loop and encodes the conditional probabilities that appear in the diagram above.
Here is what we find:

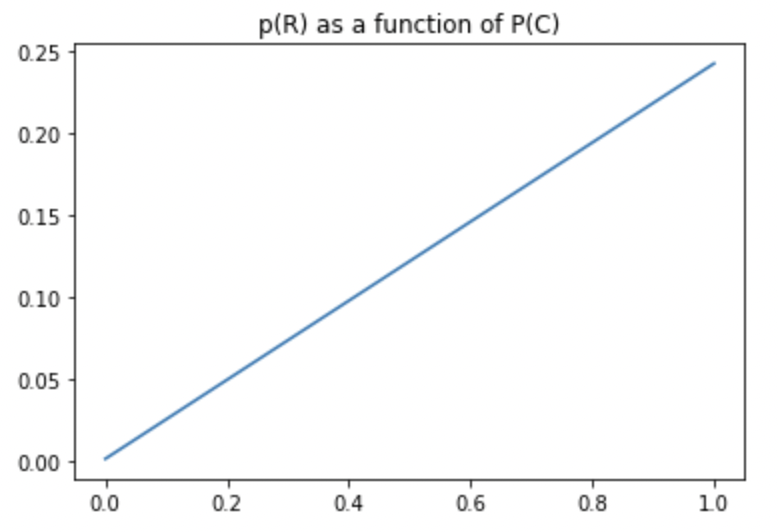
- If everyone has COVID, only $24.225$% of the population will report a positive test
- If noone has COVID, $0.118$% of the population will still report a positive test
So as we can see, the saying “the number of case is 10 times higher than the one that is reported” is wrong. Depending on the actual number of COVID cases, the number of positive tests reported at the national level will either overestimate or underestimate the real count.
Since the plot is clearly linear, we can infer from those two points that the linear formula linking $p(R)$ and $p(C)$ is:
$p(R) = 0.24107 p(C) + 0.00118$
And from it we can deduce at which point the reported number of cases goes from being an overestimation to being an underestimation:
$p(R) = 0.24107 p(C) + 0.00118 = p(C)$
$0.00118 = 0.75893 p(C) \implies p(C) \simeq 0.00155482$
So starting from $0.15$% of the population being infected, the number of reported positive COVID cases starts to underestimate the real number of cases.
Working out the formula (without computer)
To do so, we need to go back to the joint probability distribution formula that we have written before:
$p(R) = \sum_T \sum_C p(R|T,C) \sum_S p(T|S) p(S|C) p(C)$
Instead of unrolling the formula at once, let’s simplify it. We know that to get a positive test result, we first have to be tested:
$p(R=\text{true}|T=\text{false},C) = 0$
And since we are only interested in positive test results (because that’s what we observe), we can drastically simply the formula like so:
$p(R=\text{true}) = \sum_C p(R=\text{true}|T=\text{true},C) \sum_S p(T=\text{true}|S) p(S|C) p(C)$
| Case | S | C | $p(T=\text{true}|S) p(S|C) p(C)$ |
|---|---|---|---|
| Symptoms and COVID | True | True | $0.5 * 0.5 * x = 0.25 x$ |
| No Symptoms but COVID | False | True | $0.01 * 0.5 * x = 0.005 x$ |
| Symptoms no COVID | True | False | $0.5 * 0.1 * (1 - x) = 0.05 (1 - x)$ |
| No Symptoms no COVID | False | False | $0.01 * 0.9 * (1 - x) = 0.891 (1 - x)$ |
So, after multilying the cases where we have COVID with 0.95 and the others with 0.02 (the false positive rate), we end up with the following formula:
$p(R) = 0.95 * (0.25 + 0.005) x + 0.02 (0.05 + 0.009) (1 - x)$
$p(R) = 0.24225 x + 0.00118 (1 - x) = 0.00118 + 0.24107 x$
Thanksfully, the same formula as before ;)
Comments